
How can warehouse analytics improve purchasing decisions?
Warehouse analytics improves purchasing decisions by replacing guesswork with accurate, up-to-date information about what you actually have, what you are running low on, and what you rarely use. Instead of ordering based on habit or gut feeling, your team can buy based on real consumption patterns. The sections below walk through the specific ways this works in practice.
If you want to see what this looks like in a real system, Simple Storage by Aksulit is a good place to start. It gives purchasing teams the kind of live inventory visibility that makes data-driven buying genuinely practical.
What data does warehouse analytics actually track?
Warehouse analytics tracks every movement of every item in your storage space. That includes when products arrive, when they are taken out, how long they sit on the shelf, and how often stock runs out before a replenishment order arrives. The result is a clear picture of your warehouse as it is right now, not as it was last week when someone last updated a spreadsheet.
The most useful data points fall into a few broad categories. First, there is stock level data: how many units of each item are on hand at any given moment. Second, there is movement data: how quickly items are consumed over days, weeks, or months. Third, there is timing data: how long it takes from placing an order to having the item available on the shelf.
Together, these data streams answer the questions that purchasing teams actually need answered. How much do we use in a typical week? When should we reorder to avoid running out? Are we holding too much of something that barely moves? Without this data, those questions get answered with estimates. With it, they get answered with facts.
How does real-time inventory data reduce over-purchasing?
Real-time inventory data reduces over-purchasing by showing exactly what you already have before you place a new order. When stock levels update automatically every time an item is taken or returned, there is no need to order extra “just in case.” You can see the actual number on hand and buy only what the current level requires.
Over-purchasing is almost always caused by uncertainty. Buyers do not trust the numbers they have, so they add a buffer. That buffer turns into excess stock, which ties up money, takes up space, and sometimes expires or becomes obsolete before it gets used. Real-time data removes the uncertainty that drives that behavior.
There is also a secondary benefit. When your stock records are accurate, you stop discovering surprises. You do not open a cupboard and find twelve units of something you just ordered twenty more of. That kind of discovery is common in warehouses that rely on manual counts or infrequent audits, and it is expensive every time it happens.
You can read more about how this works in practice in our article on real-time stock visibility across the supply chain.
How can warehouse analytics improve demand forecasting?
Warehouse analytics improves demand forecasting by building a history of actual consumption that you can use to predict future needs. Instead of estimating how much you will need next month, you look at how much you used in the same period last year, adjusted for any changes in activity. That is a much more reliable foundation than a rough guess.
Good forecasting is not complicated. It starts with consistent, accurate data collected over time. If your warehouse system records every single withdrawal automatically, you build up a detailed consumption history without any extra effort. That history becomes your forecast baseline.
Seasonal patterns become visible quickly. You can see that certain items are used heavily in one quarter and barely touched in another. You can see which products have steady, predictable demand and which ones spike unpredictably. That knowledge shapes smarter purchasing: buying more ahead of a known busy period, buying less when demand is historically low.
The key word here is consistency. Forecasting only works when the underlying data is reliable. If stock records are updated manually and only occasionally, the forecast built on them will be unreliable too. Automated tracking removes that problem at the source.
What’s the difference between reactive and predictive purchasing?
Reactive purchasing means you buy something after you have already run out of it, or after someone raises an alarm that stock is critically low. Predictive purchasing means you buy before that point, based on data that tells you when you are likely to run low. One approach responds to problems; the other prevents them.
The practical difference shows up in two ways: cost and disruption. Reactive purchasing often means rushed orders, premium shipping costs, and operational delays while you wait for stock to arrive. Predictive purchasing lets you plan ahead, use standard lead times, and avoid the scramble entirely.
- Reactive purchasing: Triggered by a stockout or an urgent request. Often results in expedited orders and higher costs.
- Predictive purchasing: Triggered by data showing that stock will fall below a set threshold within a known time window. Allows for planned, cost-effective ordering.
Most businesses operate somewhere between the two extremes. The goal of warehouse analytics is to shift that balance toward predictive. Even moving partway in that direction reduces the frequency of stockouts and the cost of emergency orders.
Which warehouse metrics matter most for purchasing decisions?
The metrics that matter most for purchasing are the ones that directly answer “how much should we order and when.” That points to a small set of core numbers: current stock level, average daily consumption, reorder point, and lead time. Get these four right and most purchasing decisions become straightforward.
Here is what each one tells you:
- Current stock level: How many units you have right now. This is the starting point for any purchasing decision.
- Average daily consumption: How quickly you are using up stock. This tells you how long your current supply will last.
- Reorder point: The stock level at which you should place a new order, calculated to ensure you do not run out before the new delivery arrives.
- Lead time: How long it takes from placing an order to receiving the goods. This directly affects when you need to reorder.
Secondary metrics like turnover rate (how often your full stock cycles through in a given period) and carrying cost (what it costs to hold stock over time) add further depth. They help you spot items that are tying up money without moving, and items that move so fast they deserve more attention in your ordering process.
How does warehouse analytics integrate with procurement systems?
Warehouse analytics connects to procurement systems by sharing data through a direct link between the two platforms. When stock falls to a defined level, the warehouse system can automatically send a replenishment request to your procurement or ordering tool, without anyone needing to notice, check, or manually create a purchase order. The two systems talk to each other and act together.
This kind of connection removes one of the most common failure points in purchasing: the gap between knowing you need something and actually ordering it. In manual processes, that gap can be days. With an integrated system, it can be minutes or even automatic.
The practical setup is simpler than it sounds. Most modern warehouse management systems, including our own Simple Storage platform, connect to existing business software through a standard interface. You do not need to replace your current tools. You connect them, set your thresholds, and the system handles the routine ordering work from there. RFID and NFC technology in the warehouse does the automatic tracking that makes all of this possible.
For a closer look at how automated replenishment fits into this picture, our article on automatic replenishment and stockout reduction goes into more detail.
How do we help purchasing teams become data-driven?
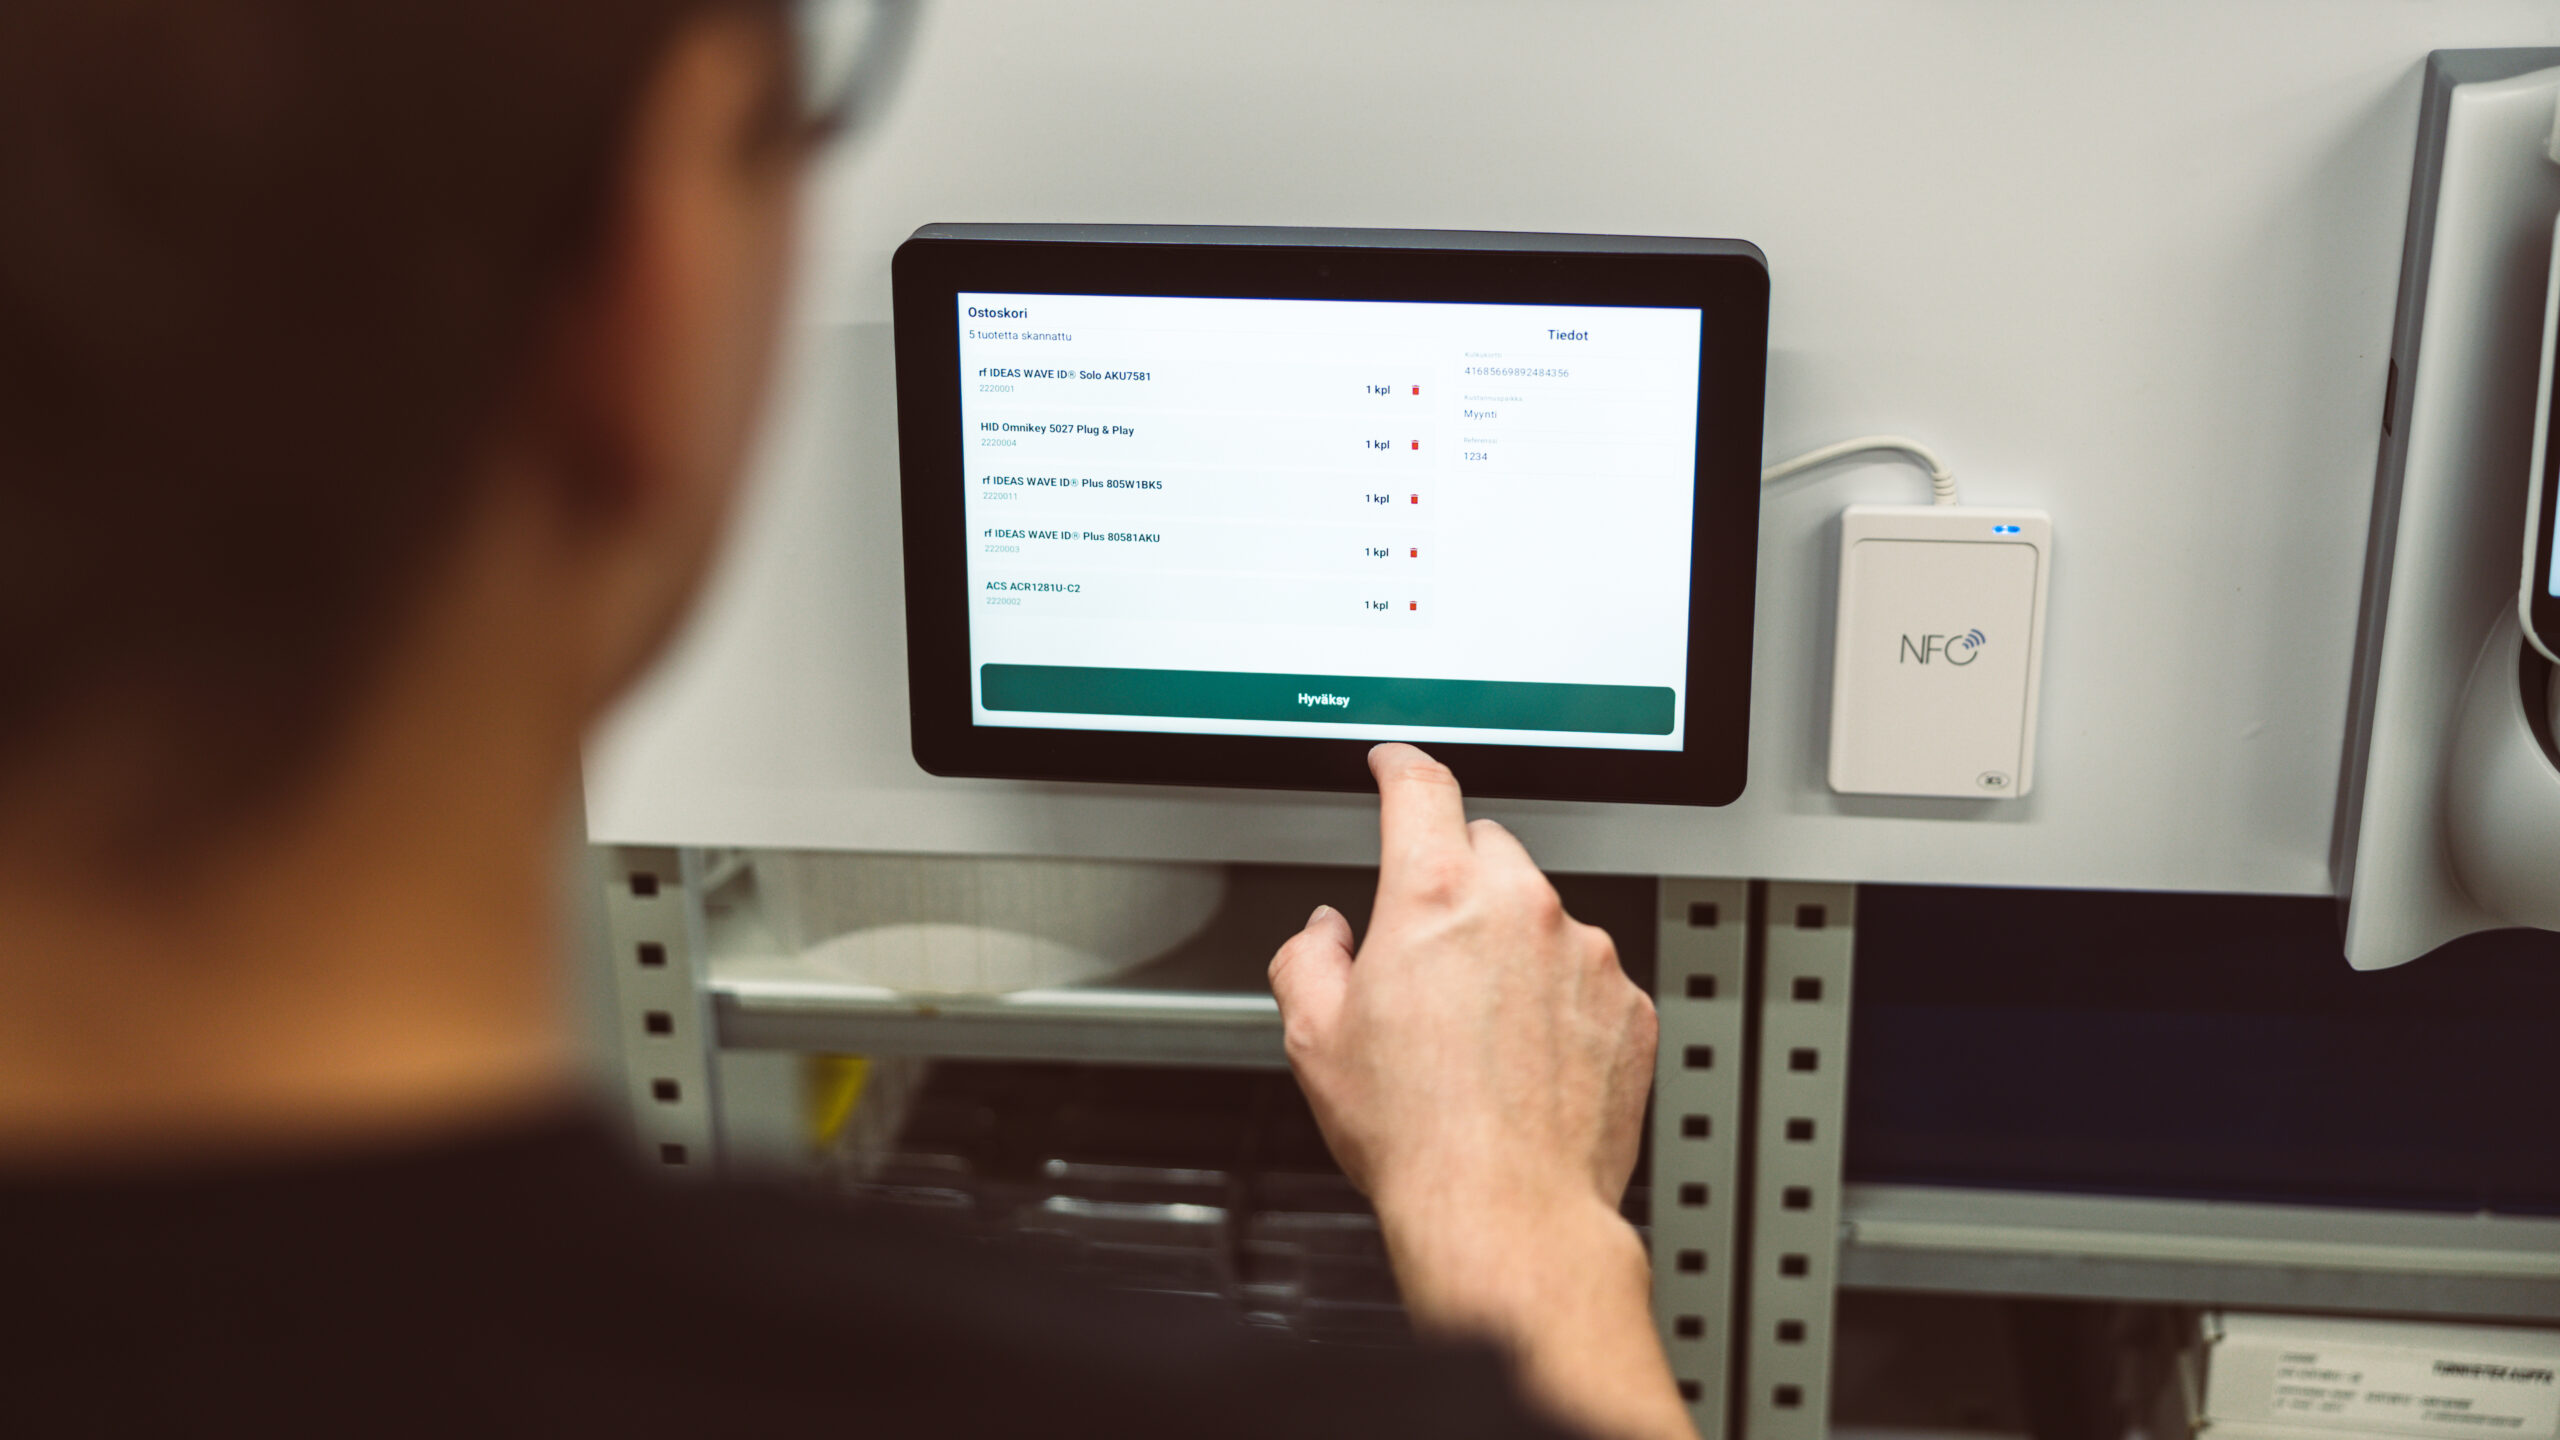
We help purchasing teams move from guesswork to data by giving them a clear, always-accurate view of their warehouse. Our Simple Storage system tracks every item automatically, updates stock levels in real time, and flags when reorder points are reached. Purchasing teams stop relying on memory, manual counts, or outdated spreadsheets, and start making decisions based on what is actually happening in their warehouse today.
The benefits our customers see most consistently include:
- Fewer stockouts because reorder triggers fire before stock runs out
- Less excess inventory because buyers can see exactly what is already on hand
- Time saved on manual counting, checking, and chasing up stock information
- Better accountability because the system records who took what and when
- Smoother supplier relationships because orders are planned rather than rushed
We have been building warehouse management systems since 2003, and we work with businesses across manufacturing, maintenance, wholesale, and equipment rental. We know that no two warehouses are identical, which is why we consult with every customer to find the right setup for their situation rather than offering a one-size-fits-all product.
If you want to find out whether warehouse analytics could improve the way your team purchases, we are happy to talk it through. Get in touch with us and we will start with a conversation about what you actually need. You can also explore Simple Storage directly to get a sense of what the system looks like in practice.